Custom Reports allows for creating your own reports based on many metrics within VolunteerHub. These are the default reports that display when accessing the Reports page
Note: This video displays the older interface which required navigating to Custom Reports after first clicking the Reports button. Custom Reports are now the default when accessing Reports.
TABLE OF CONTENTS
- Overview of Reports
- Customizing Reports
- Downloading Reports
- Saving Custom Reports
- Sharing Custom Reports
Overview of Reports

Event Cancellations
This report allows for reporting on cancellations within a date range.
The 'Is Cancelled' column denotes the registration was cancelled and can be set to show those who remained registered, but defaults to only showing cancellations.
The report is helpful for seeing how many times a specific person has cancelled or tracking cancellations across Event Groups.

By default the report contains:
- Is Cancelled (defaulted to 'True')
- Cancelled Time
- Event Start and End
- Name of the Event
- The Event Group
- Name of the Volunteer
- Username
- User Group Lineage (any value other than 'All Users' denotes a reservation)
- Slots Reserved for User Group
- Number of Slots Used
- Percentage of Slots Used
- User's Hours
Additional information available from the Column Chooser:
- Registration Time
- Check-In Time
- Check-Out Time
- Duration
- Event Registration Question
- Waiver Information
- Point Value (if applicable)
- Location
- Event Slot Limit
- User ID
- Event Group
- User Group
- Email Address
- User's Address Information
- Phone Numbers
- Birthday
- Age
- Gender
- SMS Opt-In Status
- Emergency Contact Information
- Profile Photo Information
- Is Adult Status
- Pronouns
- Event Start/End Date Only
- Event Start/End Time Only
- Email Opt-In Statuses
- Event ID
- Comments
- User Group Manager (if applicable)
Event Groups
This report contains information about your event groups. It shows the name of each event group, its ancestors (location within the hierarchy), as well as whether or not it is set to 'show as filter in schedule'.

Event Registrations
This report lists detailed event and registration information for events occurring in a specific date range as well as the users who are registered for those events.
This report can contain comment information submitted by volunteers through self-reported events.
The report defaults to displaying the current month, but can be modified by clicking the blue 'Date Range' pill.
Clicking the filter icon allows for filtering by User Group(s).
This report does not contain 'ad hoc' hours reported by a volunteer, as ad-hoc hours are not associated with any registered event. The Custom Hours report does contain ad-hoc hours.

By default the report contains:
- Event Start and End
- Name of the Event
- The Event Group
- Name of the Volunteer
- Username
- User Group Lineage (any value other than 'All Users' denotes a reservation)
- Slots Reserved for User Group
- Number of Slots Used
- Percentage of Slots Used
- User's Hours
Additional information available from the Column Chooser:
- Registration Time
- Check-In Time
- Check-Out Time
- Duration
- Event Registration Question
- Waiver Information
- Point Value (if applicable)
- Location
- Event Slot Limit
- User ID
- Event Group
- User Group
- Email Address
- User's Address Information
- Phone Numbers
- Birthday
- Age
- Gender
- SMS Opt-In Status
- Emergency Contact Information
- Profile Photo Information
- Is Adult Status
- Pronouns
- Event Start/End Date Only
- Event Start/End Time Only
- Email Opt-In Statuses
- Event ID
- Comments
- User Group Manager (if applicable)
- All other custom User Form Fields
Events
This report contains information about your events occurring in a specific date range.
The report defaults to displaying the current month, but can be modified by clicking the blue 'Date Range' pill.

By default the report contains:
- Event Start and End
- Duration
- Name of the Event
- The Event Group
- Location of the Event
- Event Slot Limit
Additional information available from the Column Chooser:
- Admin Notes
- Raiser's Edge Job (if applicable)
- Point Value (if applicable)
- Event Contact
- Waiver Information
- Donation Page (if applicable)
- Minimum Age
- Event ID
- Event Start/End Date Only
- Event Start/End Time Only
Hours
The Hours report is a new report located within Reports > Custom Reports

This report shows hours recorded for both Events as well as any self-reported hours by a user (both for Events and Ad-hoc hours).
The report defaults to displaying the current month, but can be modified by clicking the blue 'Date Range' pill.

By default this report contains:
- Username
- First Name
- Middle Name
- Last Name
- Event Name
- Hours
- Pending Approval
- Comments
- Event Start
- Event End
- Event Group Lineage
- User Group Lineage
- Mailing Address1
- Mailing Address2
- Mailing Address - City
- Mailing Address - State (or Province)
- Mailing Address - PostalCode
Additional information available from the Column Chooser:
- Check-in Time
- Check-out Time
- Duration
- Event Group Name
- User Group Name
- User ID
- Created
- Last Login
- Last Update
- Mailing Address3
- Secondary Phone Number (Mobile Phone)
- Date of Birth
- Age
- User is an Adult
- SMS Opt-In
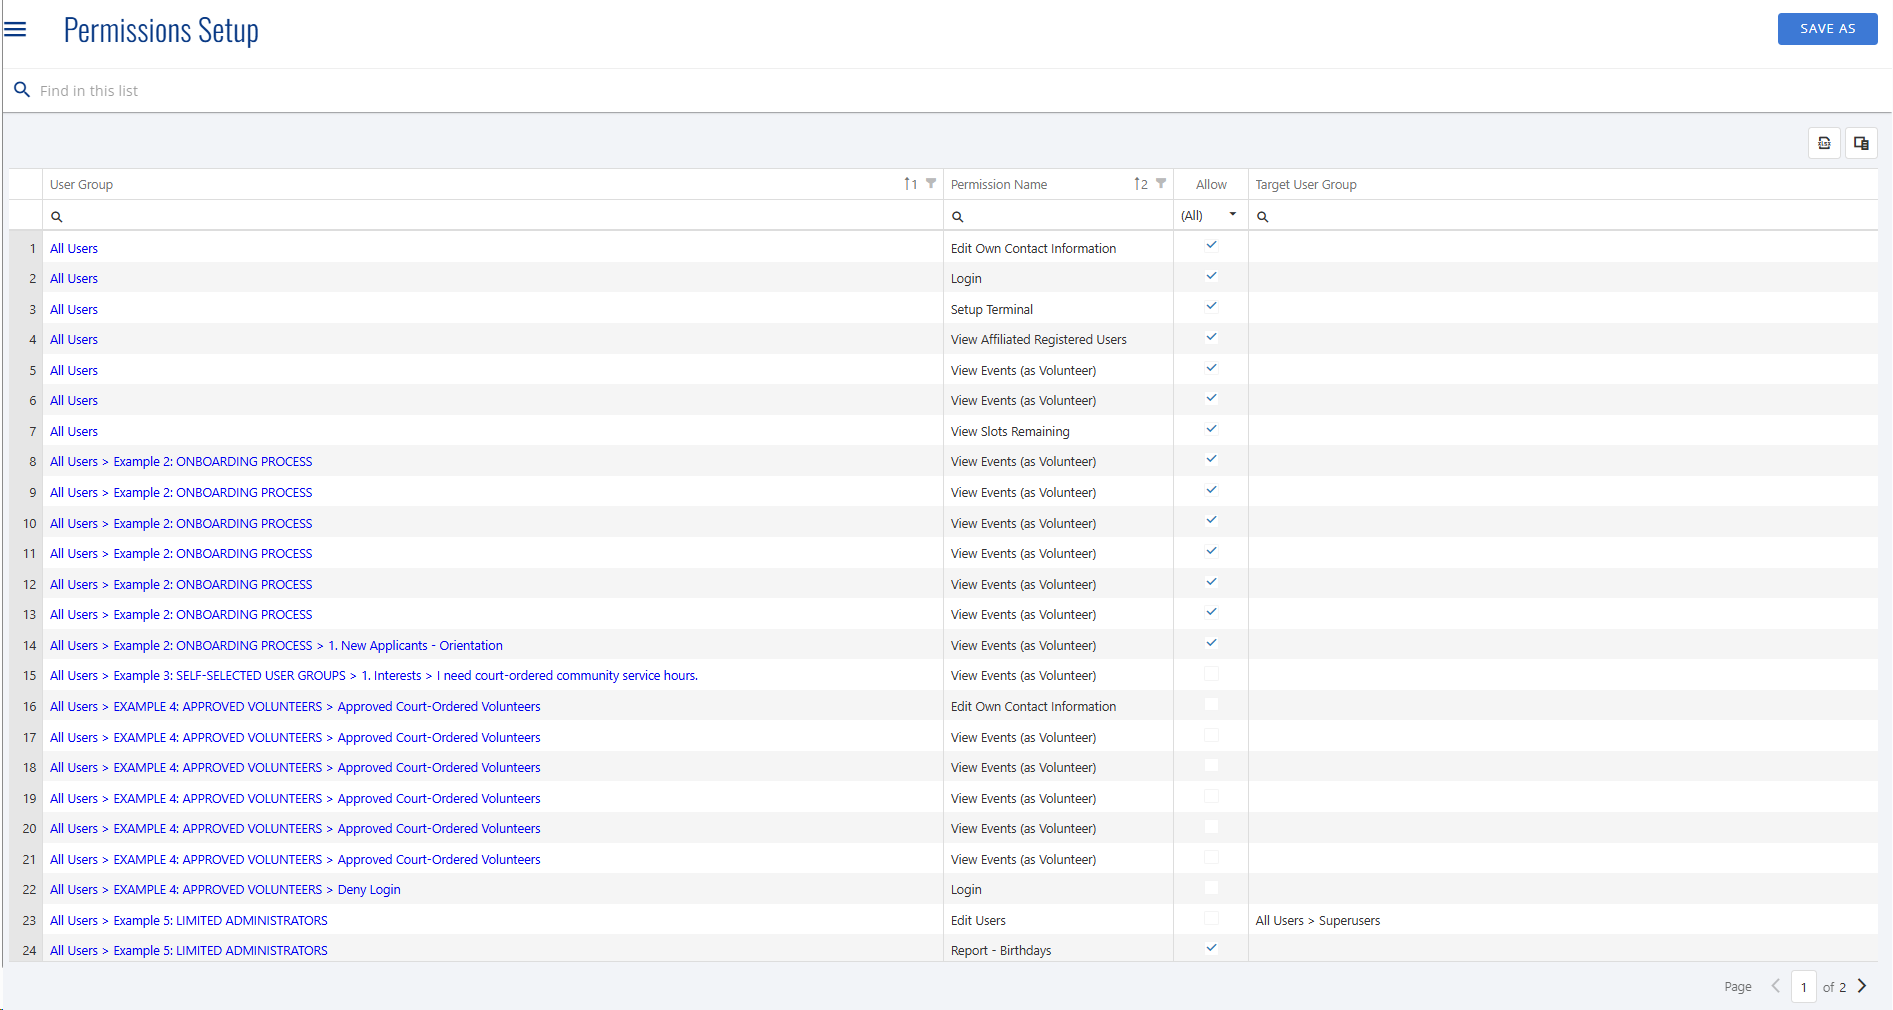
Permissions Setup
This report displays only on sites with the Advanced Permissions module. This report displays all the permissions set on User Groups within the site. Previously this information was only available by contacting Support. The report is only accessible to administrators with the ability to view User Groups.
It displays the name of the User Group, the permission, whether the permission is allowing or denying, and the event/user group the access is being granted. It includes both volunteer permissions (e.g. who can see/sign up for which event groups) as well as administrative permissions (e.g. which admins have control of which events/users).
Registration Totals by User
This report mimics the Legacy Event Participation by User report, but within the Custom Reports framework. The report provides a list of volunteers within a date range and their total number of events and hours, as well as totals. The report can be customized with user data from the Column Chooser.
This report answers the common question of "how many volunteers did I have last month and what was the total hours?"
In the example below, 4 volunteers completed 47 hours and took 20 slots across events. Had they all completed 100% of their scheduled shifts, the duration of all those shifts would have been 58.

By default this report contains:
- Username
- First Name
- Middle Name
- Last Name
- Hours
- Duration
- Event Groups
- Slots
- Mailing Address1
- Mailing Address2
- Mailing Address - City
- Mailing Address - State (or Province)
- Mailing Address - PostalCode
Additional information available from the Column Chooser:
- Created
- Last Login
- Last Update
- Mailing Address - Address3
- Phone Number
- Date of Birth
- Age
- User is an Adult
- Legacy Hours
- SMS Opt-In
- User ID
User Group Membership
This report displays each user in the system and the user groups of which they are a member.
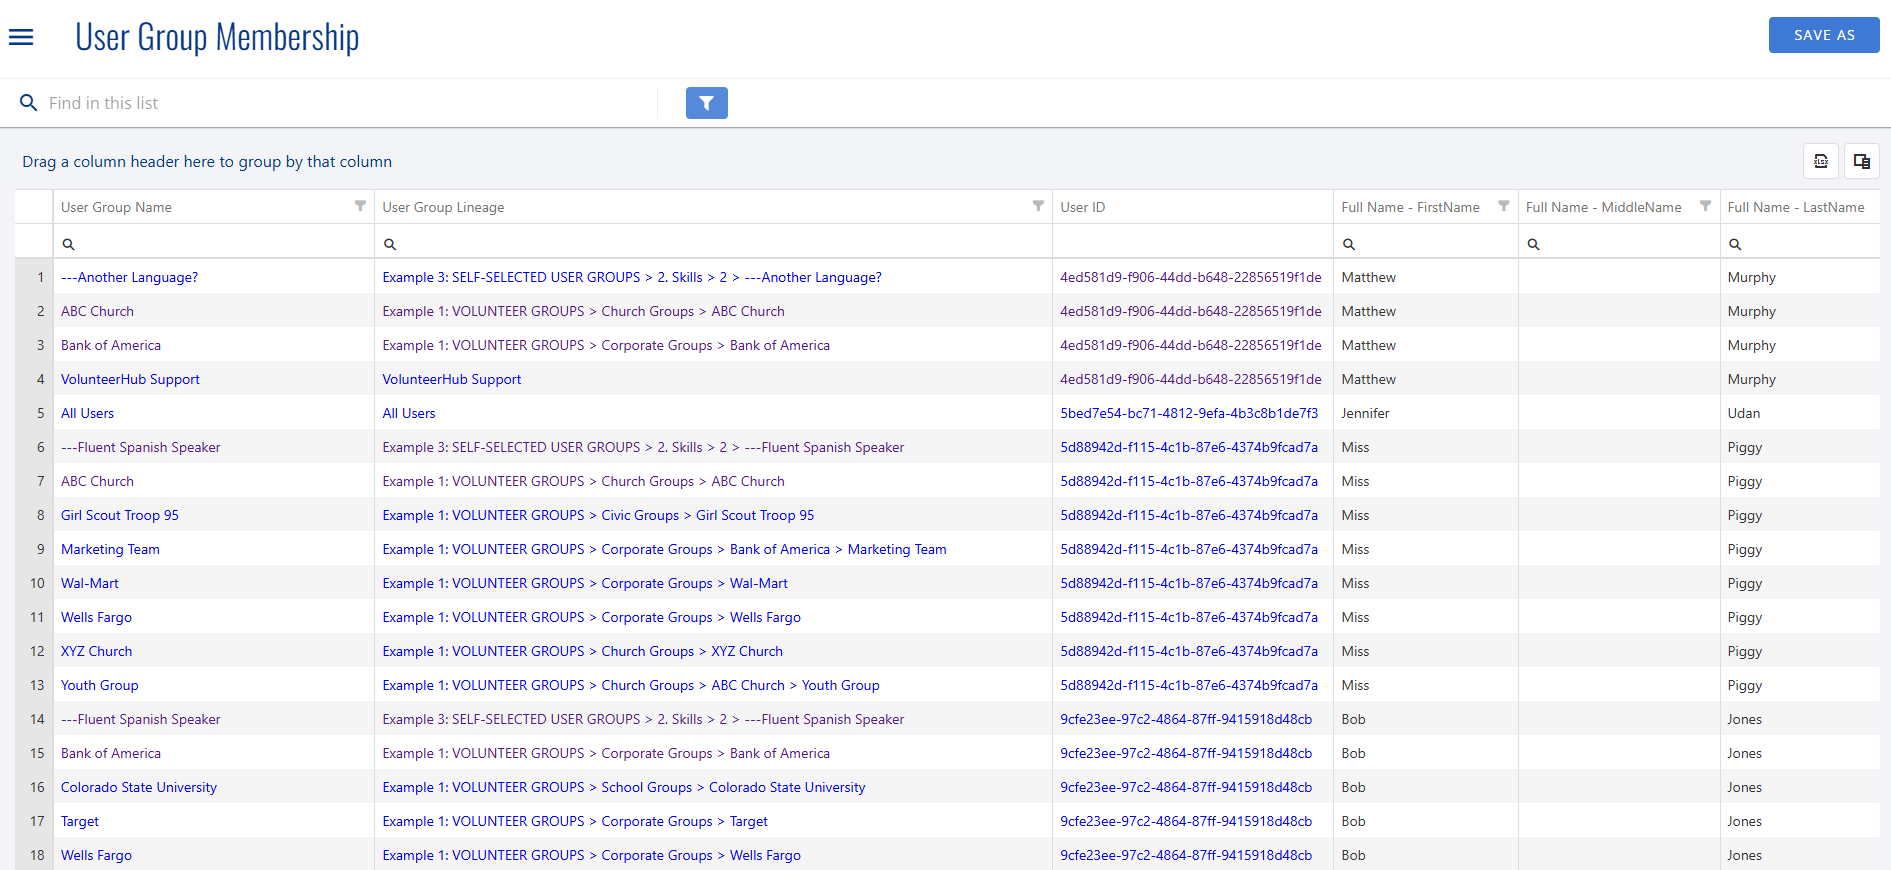
By default the report contains:
- User Group Name
- User Group Linage
- User ID
- First, Middle, and Last Name
- Email address
- Address
- Phone Numbers
- Birthday
- Age
- Is Adult User Form Question
- User is an Adult
- Group Manager (not included on all plans)
Additional information available from the Column Chooser:
- Username
- Email Opt In Newsletter
- Account Creation Date
- Last Login Date
- Last Update Date
- Name Prefix
- Additional Address Information
- Gender
- Pronouns
- SMS Opt-In Status
- Emergency Contact Information
- Next Birthday
- Event Count
- Hours Count
- Last Activity
- Is Active
- All other custom User Form fields
User Group Reservations
This report contains information about reservations placed on events within a specific date range. This report does not contain the information of who registered for the event, instead it lists each reservation, the total reserved, total used, and the hours done by that group for the event.
Any event without reserved slots shows the reservation as being for 'All Users' (unaffiliated).

To filter out unreserved entries, click the filter icon by 'User Group', and uncheck 'All Users'

Dragging the 'User Group' column to the top results in subtotals per group:

By default the report contains:
• User Group
• Event Start
• Event End
• Event Name
• User Group Reservation Slots Reserved
• Slots Used
• Hours
Additional information available from the Column Chooser:
• Location
• Event Slot Limit
• Event Group
• Event ID
• Event Start Time Only
• Event End Time Only
• Event Start Date Only
• Event End Date Only
• User Group Lineage
• Event Group Linage
User Groups
This report contains information about your user groups. It shows the name of each user group, its ancestors (location within the hierarchy), which membership control the user group is set to, as well as both administrative and public descriptions.

Additional information available from the Column Chooser:
- Join Code
- Import/Export Key
- Allow new users to join via Kiosk Status
- Created Date
- Raiser's Edge Information (if applicable)
Users
This report contains information about users.

This is the only report that also includes an 'Email' button. Clicking the Email button allows for emailing all users displayed within the report. This allows for filtering more specific lists for the purpose of communication (e.g. all users with more than 5 hours in a particular Zip Code).
By default the report contains:
- Username
- Newsletter Opt-In Status
- First, Middle, and Last Name
- Email address
- Address
- Phone Numbers
- Birthday
- Age
- Is Adult User Form Question
- User is an Adult
- Gender
- Profile Photo Information
- Pronouns
Additional information available from the Column Chooser:
- Account Creation Date
- Last Login Date
- Last Update Date
- Name Prefix
- Additional Address Information
- SMS Opt-In Status
- Emergency Contact Information
- Next Birthday
- Event Count
- Hours Count
- Last Activity
- Is Active
- User ID
- All other custom User Form fields
Customizing Reports
Hyperlinks
Some elements within Custom Reports display as hyperlinks. Clicking the hyperlink navigates to that item within the system. Clicking a username brings up that user's profile, clicking an event name brings up that specific event, etc.
This can be helpful when wanting to make changes; for example, locating a user in a report with incorrect hours for an event, now clicking the event in the report goes directly to that event for an admin to then modify.
The following are elements displayed as links:
• Username
• User Group
• Event
• Event Group
• User ID
• Event ID
Sorting
To sort by one column, click the header for that column. Based on the data, the column will then sort either alphabetically or numerically.

The arrow denotes the report is sorting based on that column. Clicking the column again reverses the sort (e.g. A-Z vs. Z-A).
To sort by a more columns, hold down the SHIFT key and click the second column.

In the example above, the report is sorted first alphabetically by last name and then descending by how many hours each person received.
Pagination
For longer reports, the report is split into multiple pages which can be navigated with arrows in the bottom right corner.

Columns
Each report contains a series of stock columns most relevant to the purpose of the report, however additional columns may be added and the stock columns may be removed.
Re-Ordering Columns:
Click and drag a column to the left or right to change its placement within the report.
Adding Columns:
- The Column Chooser appears on the right of the report by default, but can be closed by pressing the X. The Column Chooser can be reopened by pressing the button on the upper right of the report.

- From the Column Chooser, click and drag your choice to the location within the report you'd like that column to reside

The 'Search' box at the top allows for quickly locating a desired column.
Removing Columns:
With the Column Chooser open, click and drag a column out of the report and drop it into the Column Chooser.
Grouping by a Column:
Some reports (e.g. Event Registrations) contain an area at the top of the spreadsheet to drag and drop a column to then sort the report by that column data. This also adds subtotals to the report for data such as slots used and hours.
This example shows grouping the Event Registrations report by Event Group

Drag and drop a column

The report now groups the data by that column and displays totals
Filtering Based on Date Range
The Event Registration and Hours reports allow for filtering based on a data range via the pill at the top of the report.
The date range defaults to 'This Month', but can be modified:
 Date Ranges are dynamic when a report is saved. For example, should a report be saved with the date range set to 'Last Month', opening that report will always show the data of whatever the previous month was.
Filtering Based on User Group(s)
The Custom Users, Hours, and Event Registrations reports now have the ability to filter by User Groups.
1. From the report, click the filter icon and select 'User Group'
2. Choose the User Group you want to limit the report to, or select 'Filter by Multiple Groups'
Filtering by Multiple Groups allows for the same filtering options used on the Users page, such as specifically omitting users who are in a particular User Group.
Omit Community Service volunteers, Homeowners, Sweat Equity, Administrators, etc from a report to better reflect actual volunteer hours.
Filtering Data
Many columns within reports allow for filtering the data displayed within it.
Searching:
To display only a specific value within the column, click within the search area under the column header and type the value.
Point at the magnifying glass to display additional search options.

Filtering:
Click the funnel icon next to the column header to display the filtering options.

Selecting a Date:
If the column displays a date, an additional calendar icon is present to select a specific date.

Downloading Reports
To download a report as a .xlsx file, click the XLSX icon in the toolbar.


Saving Custom Reports
To save a customized report:
- Press the blue 'Save As' button in the upper right

- Name the report and press 'Save'

Saved reports display within the 'My Reports' section of the Reports page, and are only available to that user.

Saved reports set to a built-in date range (e.g. Last Week), will adjust the data displayed within the report as time progresses.
Once within a custom report, any changes made result in the options to 'Save' or 'Save As'. Press 'Save' to overwrite your existing custom report. Press 'Save As' to save a new custom report.

To delete a custom report, click the ellipsis button for that report and choose 'Delete'.
Sharing Custom Reports
When saving a Custom Report there is an option to share it with other administrators who have access to Custom Reports.

These reports display under the Shared Reports header within Custom Reports.

All "Superusers" groups have been granted this permission. If you have any Limited Administrator user groups which you would like to allow to edit which reports are Saved (and accessed by all admins), please contact Support with the name(s) of the User Group(s) so that the permission can be added. Users with this permission can share, edit, delete, and 'un-share' any Shared Reports.